Minimum Lines to Represent a Line Chart
MediumUpdated: Aug 2, 2025
Practice on:
Problem
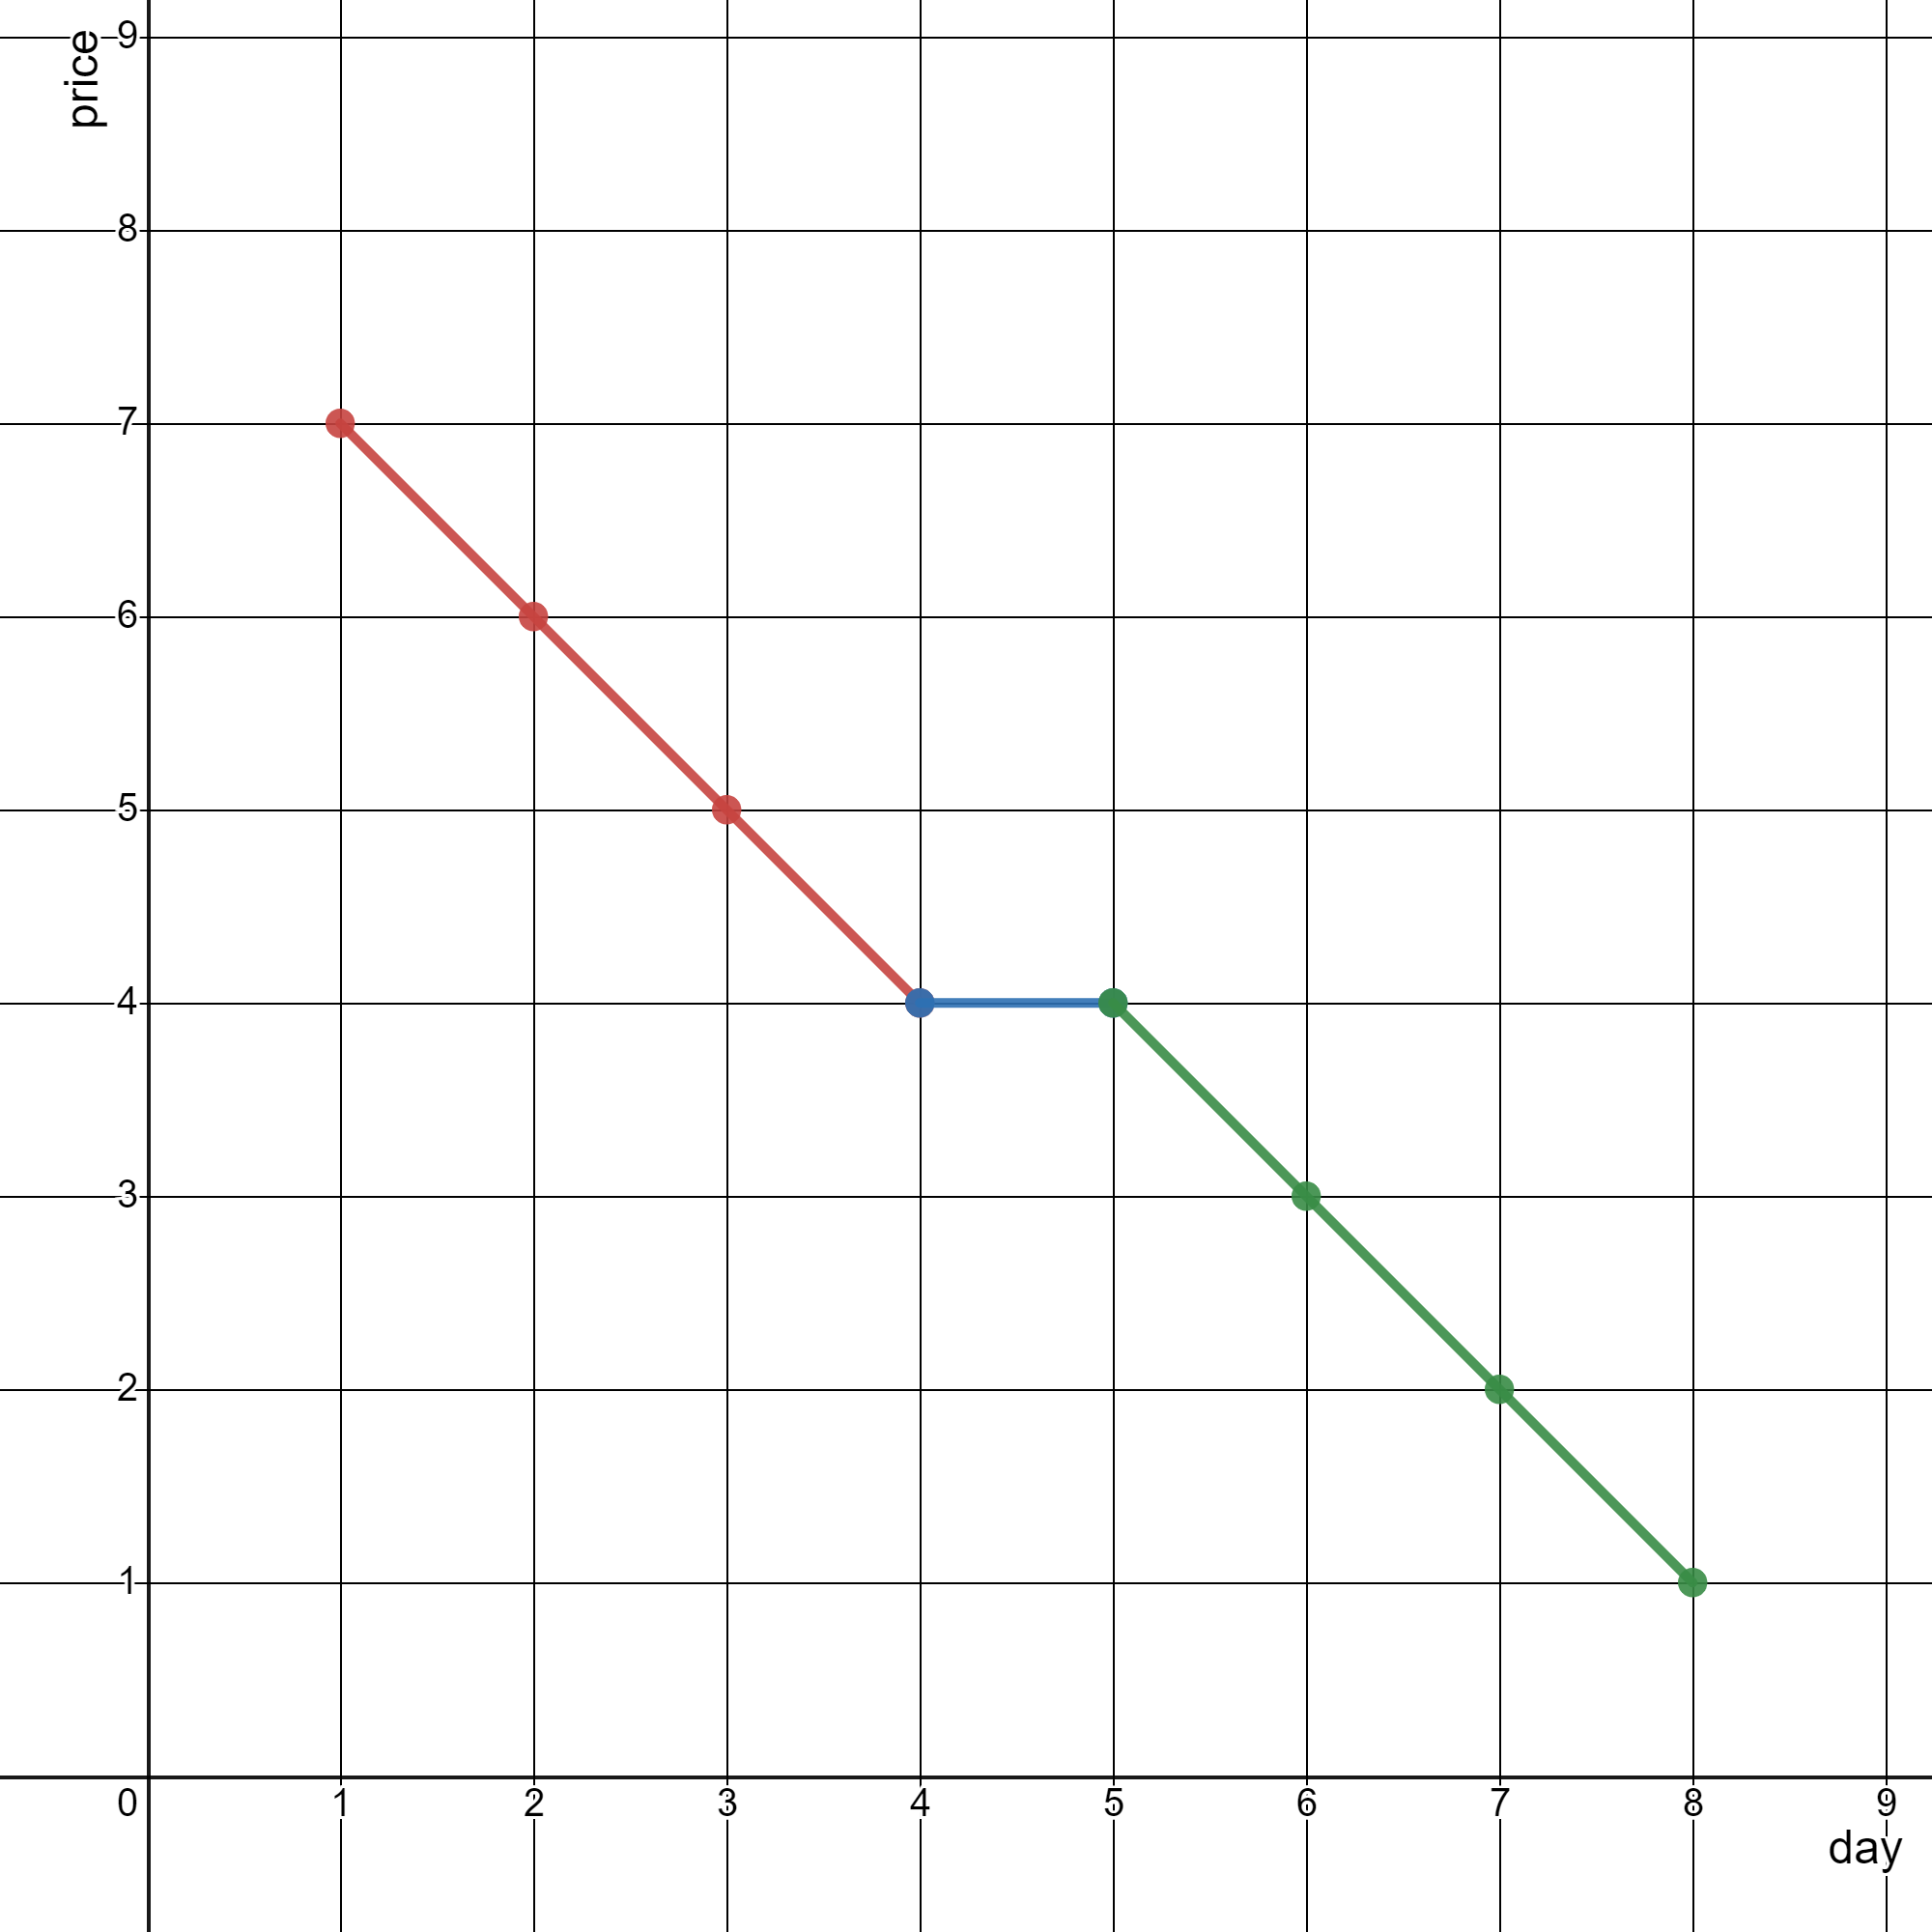
You are given a 2D integer array stockPrices where stockPrices[i] = [dayi, pricei] indicates the price of the stock on day dayi is pricei. A line chart is created from the array by plotting the points on an XY plane with the X-axis representing the day and the Y-axis representing the price and connecting adjacent points. One such example is shown below:

Return theminimum number of lines needed to represent the line chart.
Examples
Example 1

Input: stockPrices = [[1,7],[2,6],[3,5],[4,4],[5,4],[6,3],[7,2],[8,1]]
Output: 3
Explanation:
The diagram above represents the input, with the X-axis representing the day and Y-axis representing the price.
The following 3 lines can be drawn to represent the line chart:
- Line 1 (in red) from (1,7) to (4,4) passing through (1,7), (2,6), (3,5), and (4,4).
- Line 2 (in blue) from (4,4) to (5,4).
- Line 3 (in green) from (5,4) to (8,1) passing through (5,4), (6,3), (7,2), and (8,1).
It can be shown that it is not possible to represent the line chart using less than 3 lines.
Example 2

Input: stockPrices = [[3,4],[1,2],[7,8],[2,3]]
Output: 1
Explanation:
As shown in the diagram above, the line chart can be represented with a single line.
Constraints
1 <= stockPrices.length <= 10^5stockPrices[i].length == 21 <= dayi, pricei <= 10^9- All
dayiare distinct.
Solution
Method 1 – Slope Comparison with Sorting
Intuition
To minimize the number of lines, we need to count how many times the slope between consecutive points changes. If the slope remains the same, the points are collinear and can be represented by a single line.
Approach
- Sort the points by day (x-coordinate).
- Iterate through the sorted points and compare the slope between each pair of consecutive segments.
- If the slope changes, increment the line count.
- Return the total number of lines needed.
Code
C++
class Solution {
public:
    int minimumLines(vector<vector<int>>& stockPrices) {
        sort(stockPrices.begin(), stockPrices.end());
        int n = stockPrices.size();
        if (n <= 1) return 0;
        int ans = 1;
        for (int i = 2; i < n; ++i) {
            long long x1 = stockPrices[i-2][0], y1 = stockPrices[i-2][1];
            long long x2 = stockPrices[i-1][0], y2 = stockPrices[i-1][1];
            long long x3 = stockPrices[i][0], y3 = stockPrices[i][1];
            if ((y2-y1)*(x3-x2) != (y3-y2)*(x2-x1)) ans++;
        }
        return ans;
    }
};
Go
import "sort"
func minimumLines(stockPrices [][]int) int {
    sort.Slice(stockPrices, func(i, j int) bool {
        return stockPrices[i][0] < stockPrices[j][0]
    })
    n := len(stockPrices)
    if n <= 1 { return 0 }
    ans := 1
    for i := 2; i < n; i++ {
        x1, y1 := stockPrices[i-2][0], stockPrices[i-2][1]
        x2, y2 := stockPrices[i-1][0], stockPrices[i-1][1]
        x3, y3 := stockPrices[i][0], stockPrices[i][1]
        if (y2-y1)*(x3-x2) != (y3-y2)*(x2-x1) {
            ans++
        }
    }
    return ans
}
Java
class Solution {
    public int minimumLines(int[][] stockPrices) {
        Arrays.sort(stockPrices, (a, b) -> a[0] - b[0]);
        int n = stockPrices.length;
        if (n <= 1) return 0;
        int ans = 1;
        for (int i = 2; i < n; i++) {
            long x1 = stockPrices[i-2][0], y1 = stockPrices[i-2][1];
            long x2 = stockPrices[i-1][0], y2 = stockPrices[i-1][1];
            long x3 = stockPrices[i][0], y3 = stockPrices[i][1];
            if ((y2-y1)*(x3-x2) != (y3-y2)*(x2-x1)) ans++;
        }
        return ans;
    }
}
Kotlin
class Solution {
    fun minimumLines(stockPrices: Array<IntArray>): Int {
        stockPrices.sortBy { it[0] }
        val n = stockPrices.size
        if (n <= 1) return 0
        var ans = 1
        for (i in 2 until n) {
            val (x1, y1) = stockPrices[i-2]
            val (x2, y2) = stockPrices[i-1]
            val (x3, y3) = stockPrices[i]
            if ((y2-y1)*(x3-x2) != (y3-y2)*(x2-x1)) ans++
        }
        return ans
    }
}
Python
def minimum_lines(stockPrices: list[list[int]]) -> int:
    stockPrices.sort()
    n = len(stockPrices)
    if n <= 1:
        return 0
    ans = 1
    for i in range(2, n):
        x1, y1 = stockPrices[i-2]
        x2, y2 = stockPrices[i-1]
        x3, y3 = stockPrices[i]
        if (y2-y1)*(x3-x2) != (y3-y2)*(x2-x1):
            ans += 1
    return ans
Rust
impl Solution {
    pub fn minimum_lines(stock_prices: Vec<Vec<i32>>) -> i32 {
        let mut sp = stock_prices;
        sp.sort();
        let n = sp.len();
        if n <= 1 { return 0; }
        let mut ans = 1;
        for i in 2..n {
            let (x1, y1) = (sp[i-2][0], sp[i-2][1]);
            let (x2, y2) = (sp[i-1][0], sp[i-1][1]);
            let (x3, y3) = (sp[i][0], sp[i][1]);
            if (y2-y1)*(x3-x2) != (y3-y2)*(x2-x1) {
                ans += 1;
            }
        }
        ans
    }
}
TypeScript
class Solution {
    minimumLines(stockPrices: number[][]): number {
        stockPrices.sort((a, b) => a[0] - b[0]);
        const n = stockPrices.length;
        if (n <= 1) return 0;
        let ans = 1;
        for (let i = 2; i < n; i++) {
            const [x1, y1] = stockPrices[i-2];
            const [x2, y2] = stockPrices[i-1];
            const [x3, y3] = stockPrices[i];
            if ((y2-y1)*(x3-x2) !== (y3-y2)*(x2-x1)) ans++;
        }
        return ans;
    }
}
Complexity
- ⏰ Time complexity:
O(n log n), where n is the number of points. Sorting dominates. - 🧺 Space complexity:
O(1), only a few variables are used for tracking the answer.